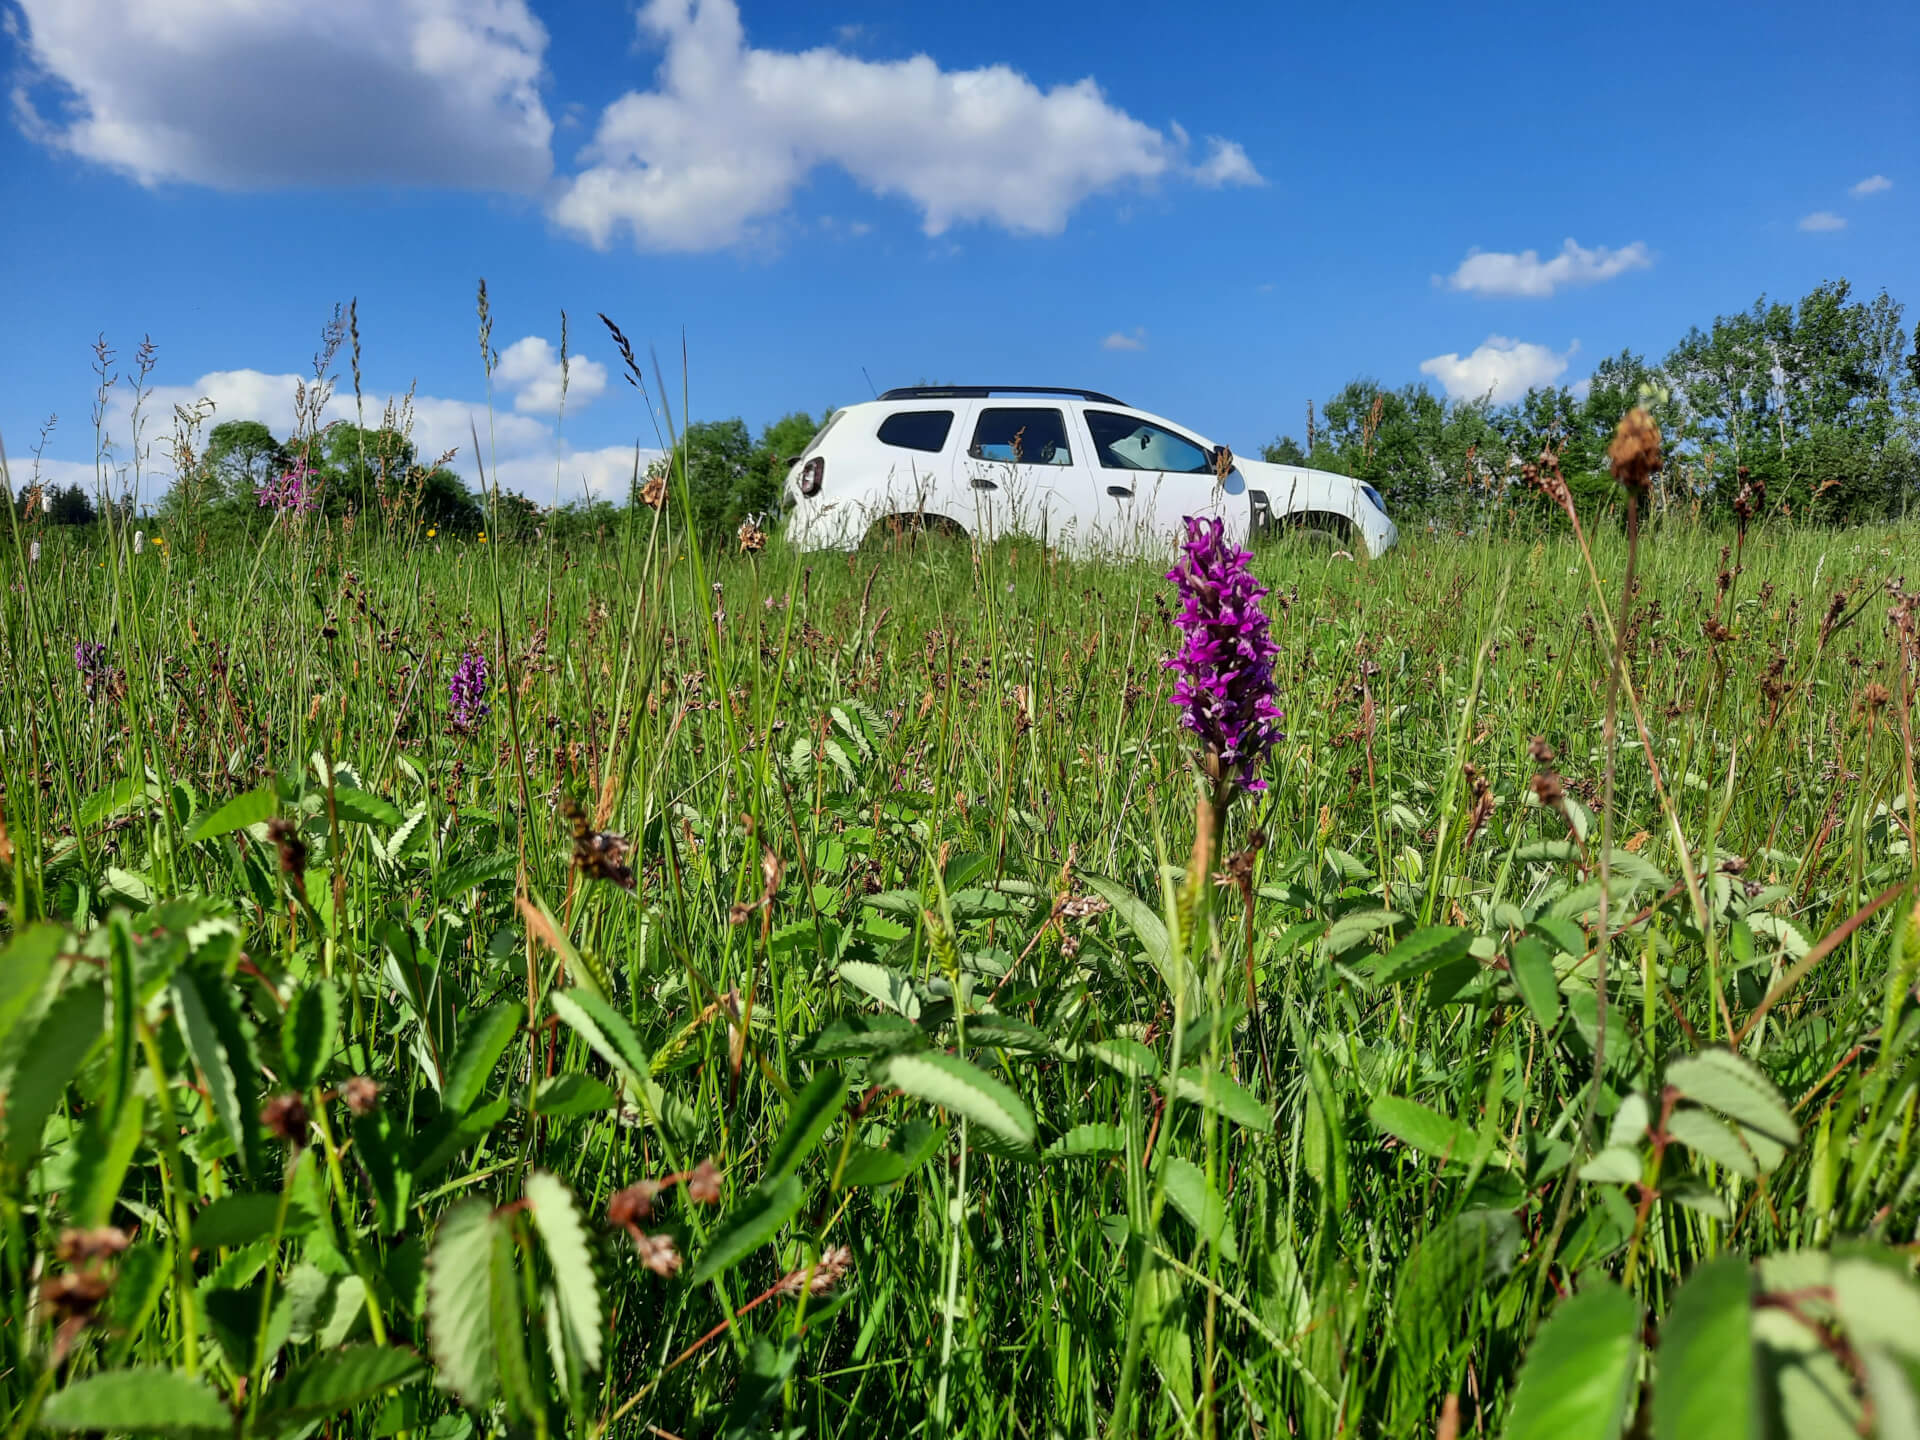
Conducting an inventory for strategic railway infrastructure required the efficient analysis of vast amounts of spatial data. By integrating GIS systems with automated analysis, we were able to accurately pinpoint biodiversity hotspots. This reduced the risk of environmental conflicts and made it possible to plan the optimal route option.
Ansee’s scope
Inventory and environmental assessment of areas designated for the future railway lines.
Challenge: Vast scale of analysis and spatial diversity
The Central Transport Hub is one of the largest and most strategic infrastructure projects in Poland. As part of planning the new railway network, our team faced a challenge: how to carry out an environmental analysis for kilometers of routes, often branching and running through highly varied natural environments?
Our task was to pinpoint the areas of highest natural value (so-called hotspots) so we could optimize the routing of the new railway lines with the least possible impact on the natural environment.
Solution: Modern methods of spatial assessment
Given the vast scope of the analyses – covering several route alternatives and wide buffers – we used an integrated GIS approach that combined automated analysis with on-site verification by our experts.
1. Spatial data integration (BDOT + CLC)
We combined two key data layers:
- BDOT (Topographic Object Database) – a detailed national database containing land cover information;
- Corine Land Cover (CLC) – a European spatial database.
By bringing these two layers together, we could quickly identify biodiversity hotspots and areas of low ecological value.
2. Automation and generalization of results
We used GIS algorithms for the initial assessment, which significantly reduced the need for labor-intensive manual analysis. The results were then generalized and filtered to remove irrelevant data through orthophoto analysis and the elimination of point errors.
3. Field verification – Confirming the effectiveness
Based on the digital assessment, we prepared field maps that our specialists then verified during site visits. Result? Our GIS analyses matched the actual on-the-ground conditions in over 90% of cases. Our experts confirmed the accuracy of the identified areas – both valuable and degraded.
4. Improved planning of fieldwork
Accurate assessment allowed us to plan precisely which specialist (botanist, chiropterologist, ornithologist) to send to a specific location, and when. If certain areas were flagged as potentially rich in invasive species, for instance, the botanists’ field trips were scheduled for late summer, when those species are easiest to detect.
Result: Environmental data ready for investment planning
The data we gathered forms the foundation for the next stages of CPK planning. The project produced a detailed valuation map showing:
- areas of high natural value (biodiversity hotspots);
- degraded areas or those lacking natural value;
- priorities and schedules for field research.
This knowledge base supports better project planning and helps prevent potential environmental conflicts as early as the design phase. It will also make it possible to provisionally select the environmentally optimal route before the year-long environmental inventory is complete.
Every project is unique
No two projects are alike, and no two natural areas are identical. That’s why at Ansee we approach each project individually, choosing the methods, tools, and team of specialists that best fit its needs.
We combine modern GIS analysis with ecological knowledge and the experience of our field experts. This lets us identify where and how to locate biodiversity hotspots that may be critical for sound project planning and effective environmental protection.